Thursday 29 November 2012

Quick and dirty coding: count DNA base composition in bash

Another installation in my (completely non-ordered, non-structured) quick and dirty code series; here's a way to easily measure the base composition of all of the reads in a fastq file (if you want to check your GC content say) in bash.

I was going to say a quick way, but objectively, it's probably not. Bash is really not an appropriate language to be doing this kind of thing in, but if you're working a lot in the terminal for other things it's sometimes convenient to just have a stock of bash-only scripts for common tasks.

 echo sed '1~4d;3~4d;4~4d' FILENAME.FASTQ | sed s/./\&~/g | tr "~" "\n" | grep "A" | wc -l  
 echo sed '1~4d;3~4d;4~4d' FILENAME.FASTQ | sed s/./\&~/g | tr "~" "\n" | grep "C" | wc -l  
 echo sed '1~4d;3~4d;4~4d' FILENAME.FASTQ | sed s/./\&~/g | tr "~" "\n" | grep "G" | wc -l  
 echo sed '1~4d;3~4d;4~4d' FILENAME.FASTQ | sed s/./\&~/g | tr "~" "\n" | grep "T" | wc -l  

As I'm hoping for these to possibly provide some assistance to people who know less about bioinformatics and programming than me (perhaps the smaller end of the wedge, but still significant), I'm going to try and provide some comments and context, so that people can learn from these as well as just use them.

Of note in this example is the first sed term used here (between the echo and the pipe ("|")), which is one that I find myself using very frequently for preliminary analysis of NGS data. All it does it look through a text file and send every 2nd line of four (N-4d just ignores the Nth line of every four lines) and send that to standard out (so either to the terminal or the next process in the pipe)

In a fastq file this setup outputs the sequence line, but obviously it's very easily adapted to output any of the lines you're interested in, from any repetitively structured text file.

In case people might want a marginally more detailed readout (with a bit more of a time penalty), I threw together the following bash script, which I saved as BaseComposition.sh, which I've commented to give a little flavour of some of the things one can do in bash (however inappropriately). Note that bash by default can only do integer arithmetic; you need to use bc or awk or something else to use floats.

 # Jamie Heather, UCL, November 2012  
   
 # Short bash script to give a quick read-out of the DNA base composition of a fastq file  
 # Run with command:  
 # $ sh BaseComposition.sh FILENAME.fastq  
   
 # Takes an input b, then runs through following pipe, whereby:  
 # every second line of 4 line repeat (i.e. sequence line) taken | sed adds tildes between each character | tr replaces tildes for new lines | grep counts each character | wc counts each hit  
 # Then feeds each base into it's own variable  
 ACOUNT=$(sed '1~4d;3~4d;4~4d' $1 | sed s/./\&~/g | tr "~" "\n" | grep "A" | wc -l)  
 CCOUNT=$(sed '1~4d;3~4d;4~4d' $1 | sed s/./\&~/g | tr "~" "\n" | grep "C" | wc -l)  
 GCOUNT=$(sed '1~4d;3~4d;4~4d' $1 | sed s/./\&~/g | tr "~" "\n" | grep "G" | wc -l)  
 TCOUNT=$(sed '1~4d;3~4d;4~4d' $1 | sed s/./\&~/g | tr "~" "\n" | grep "T" | wc -l)  
   
 # Adds up all the individual bases   
 TOTALBASES=$(($ACOUNT + $CCOUNT + $GCOUNT + $TCOUNT))  
   
 # Prints out both the number of hits for each base, and the percentage of that each base's contribution to the whole  
 echo "\n"  
 echo A bases: "\n"$ACOUNT "\n"Percentage A:  
 echo "scale=2;$ACOUNT/$TOTALBASES"*100 | bc  
 echo "\n"  
 echo C bases: "\n"$CCOUNT "\n"Percentage C:   
 echo "scale=2;$CCOUNT/$TOTALBASES"*100 | bc  
 echo "\n"  
 echo G bases: "\n"$GCOUNT "\n"Percentage G:   
 echo "scale=2;$GCOUNT/$TOTALBASES"*100 | bc  
 echo "\n"  
 echo T bases: "\n"$TCOUNT "\n"Percentage T:   
 echo "scale=2;$TCOUNT/$TOTALBASES"*100 | bc  

Tuesday 27 November 2012

Don't count your clusters before they hatch...

I've dropped a few veiled hints about my previous disastrous runs on the MiSeq (which I do plan to write up eventually, but the anguish is still too fresh), but today we got samples from our revised strategy running on the machine.

This is the first of our samples we've run ourselves (well, that we set up at the genomics expert's direction), and as such we were pretty excited to watch the data start to roll out in real time, particularly in light of our previous failures.

Then it happened. The first data to pop up in BaseSpace looked like this:


There's a couple of things that put the fear in me here.

The first is the upper panel; not only are the intensities quite low, some even below 200, they are going up.

The second is the more worrying; from our lower panel we can see that not only do we have relatively low cluster density (300k/mm2 when we aim for 800k/mm2, see blue box), but it looks like none of them have passed filter (indicated by the green box smooshed into zero on the axis).

Like I say, this is only the first run I've watched from the very beginning, so I was hoping that this was just a feature of it counting the clusters in earlier cycles before finishing the filter checks at cycle 25, as I'd read in some Illumina documentation.

However, I wasn't sure, so I spent a paranoid five minutes trying to double check whether this was the case, to no avail at all (and obviously I couldn't find the Illumina reference where I'd read it in the first place).

So it was with much relief that, when cycle 25 ticked over, this happened:


Phew. We might not have many clusters, but at least most of them are passing filter.

To anyone who's done more than one run this post probably seems like a lot of fuss about nothing, but I certainly spent those five minutes googling with my stomach turning over. Hopefully if anyone else finds themselves in a similar scenario, they might find their way here and heed this advice; just wait for cycle 25.

As an aside, the run is currently at cycle 150, and the intensities are still rising. Is this perhaps a feature of the v2 kits, or something more anomalous? Until I have a play with the sequence tomorrow, I'm reluctant to speculate on what this might mean.

Update:

The machine's still running, but I've got some feedback about the funny error profile, after I posted it on twitter. It turns out that this is to be expected in v2 kits. Good to know!

Sunday 25 November 2012

DeleT-cells

I covered an interesting (if slightly intricate) paper for journal club last week, so I thought I'd go over some of the major techniques and findings here. Note that while I'm going to try to keep it simple, (for the purposes of this post) I'm going to assume a rudimentary knowledge of immunology.

First off, here is the paper, that came out in last month's edition of Immunity, entitled "Subsets of Nonclonal Neighboring CD4+ T Cells Specifically Regulate the Frequency of Individual Antigen-Reactive T Cells"1.

Coming from the group of Ronald Schwartz at the NIH, this body of work is interested in the mechanisms of T cell homeostatis.

Let's get fundamental. Our bodies are of a finite size, so we can only fit so many cells in our circulatory systems and tissues. In terms of our T cells, we want to keep as wide a repertoire of different T cell receptor (TCR) bearing clones as possible, to maximise the number of potential pathogens and challenges we can recognise.

However, after a T cell gets activated by its cognate pMHC target (and has expanded and differentiated into effector cells to clear the challenge), how does our body get rid of all those expanded clones, contracting that population and only that population?

This work builds on previous work from the same lead author, Nevil Singh, where they noticed something interesting2.

In order to understand what's gone on, I just need to explain a few of the basics of their model systems.

Both papers make heavy use of adoptively transferring transgenic-TCR bearing T cells, into mice which either have their own endogenous T cell machinery in place, or who are T cell deficient (CD3ε knock outs).

The main cell they transfer are 5C.C7 T cells, which bear a TCR that recognises a peptide of PCC (pidgeon cytochrome C). This group's previous paper found that when transferred into mice that express PCC (under a MHC-I promoter), one of two things can happen.

If the recipient mouse lacks its own, functioning T cell system (PCC+/Cd3e-/-) then the transferred 5C.C7 T cells persist in that mouse, causing an autoimmune arthritis. 

If the recipient mouse has it's own T cells however (PCC+/Cd3e+/+), then the 5C.C7 T cells not only fail to cause any disease, but they actually disappear from that mouse over time. Or, as they would have it, the 5C.C7 cells get 'deleted'.

At the start of this recent paper, they recapitulate this finding in a neat experiment where they transfer 5C.C7 cells (from transgenic, Rag2-/- mice3) into PCC+/Cd3e-/- mice, under one of three conditions; either alone, or having received a million CD4+ or CD8+ polyclonal T cells the day before (figure 1A). 

It seems that the deletor activity they'd noticed previously is entirely due to some component of a polyclonal CD4+ response.

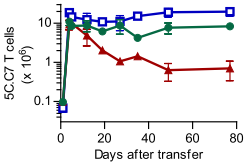
Figure 1A (from the paper1): Survival of 5C.C7 T cells transferred into a T cell deficient mouse (blue line), compared against mice who received one million CD8+ (green line) or CD4+ (red line), measured in pooled lymph node and spleen. 5C.C7 cells measured by double staining for CD4 and Vβ3, the beta variable gene used in the 5C.C7 TCR.

However, when they go on to try and narrow down what CD4+ T cell might be responsible, the deletor phenotype doesn't appear to easily fractionate to any obvious subset.

Without a clear smoking gun, they adopt an alternate tack. They knew that transferring a million CD4 T cells into the target mouse protected them from the persistence and pathology of the 5C.C7 cells. So, they thought to try and divide this million up, and see which fractions (if any) remain deletors.

To do this they flow sort polyclonal CD4+ T cells into random pools of 100 cells, which they call 'centipools'. Each centipool is then expanded in vitro, and then a million of each expanded population is transferred into a mouse to assay for 5C.C7 deletor activity.

They found that of the 54 centipools tested, there were three that seemed to recapitulate the entire deletor phenotype.

They probed these pools all manor of ways to see if they could pin down what was responsible. They ran microarrays and sequenced TCR genes; nothing seemed to correlate with deletor ability, and nor was any one TCR clone shared across all three centipools.

With no hook to hang a hypothesis on, they go on the attack, and simply take all the TCR sequences from the strongest-deletor centipool and generate retrogenic TCR T cells for each of them.

Transferring these retrogenic T cells into the PCC+, T cell deficient mice reveals that within a given centipool, there's only one clone that's reponsible for all of the deletor phenotype. Moreover, this clone deletes 5C.C7 even in PCC- mice; there doesn't need to be target antigen present!

The authors then turn back to the literature; 5C.C7 is a well-studied TCR, perhaps there's something in the back catalogue that might be pertinent. Lo and behold, it turns out there are other peptides to which 5C.C7 is known to react, including one from the endogenous retrovirus GP, which is implicated in positively selecting 5C.C7 in the thymus4.

There follows some fairly fiddly experiments (which probably contain the least convincing data in the paper), where they reportedly show that this GP-derived peptide is actually a shared ligand for both the 5C.C7 TCR and the retrogenic TCR cloned from the deletor centipool.

You have to pump the mice full of GP peptide, but it seems that eventually you do see a slight proliferation of both 5C.C7 and deletor T cell, a feature which interestingly could not be repeated in vitro. Apparently, all other assays failed to assign the GP peptide as a stimulating ligand for either cell type.

So, show me the model.

The idea is that different, unrelated T cell clones can be categorised into colonies, based on shared, sub-threshold ligands (e.g. the 5C.C7 and deletor cells described in the paper).

If a member of a colony gets expanded by its (above threshold) ligand, it will expand. However, the contraction phase will then be mediated at the colony-level, enforced by other clonotypes within that colony, preventing collateral damage to non-colonial T cells and thus maintaining a rich, diverse TCR repertoire.

I really quite like this paper; it was a fiddly finding to unravel, and they make use of a number of techniques to do so. I'm not 100% convinced about the GP peptide, but should it be true it's an incredibly intriguing finding. It also would have been nice if they'd made inroads into finding out the mechanism of this colony-regulation, but I suppose there's always the next paper.

My PhD project is all about sequencing TCR repertoires, and day-to-day we tend to operate one the naive assumption that by-and-large the information required to maintain a given T cell clone's population is wrapped up in the genotype and phenotype of that clone. The idea that every T cell clonotype could be modulated by several others within its colony (and in turn be modulating that colony's other members) is fascinating, and could well represent another level of intricate regulation to a marvellously complex biological system.


For an alternative write up of this paper, this edition of the journal also featured a preview of the piece.

If you're interested, you can also check out the prezi presentation I gave in my journal club presentation of this paper.


1. Singh, N. J., Bando, J. K., & Schwartz, R. H. (2012). Subsets of Nonclonal Neighboring CD4(+) T Cells Specifically Regulate the Frequency of Individual Antigen-Reactive T Cells. Immunity, 37(4), 735-46. Elsevier Inc. doi:10.1016/j.immuni.2012.08.008 ($)

2. Singh, N. J., Chen, C., & Schwartz, R. H. (2006). The impact of T cell intrinsic antigen adaptation on peripheral immune tolerance. PLoS biology, 4(11), e340. doi:10.1371/journal.pbio.0040340

3. As these are Rag2 knock outs they would be unable to undergo endogenous V(D)J rearrangement, and thus will only produce mature T cells for the transgenic 5C.C7 receptor


4. Ebert, P.J., Jiang, S., Xie, J., Li, Q.J., and Davis, M.M. (2009). An endogenous positively selecting peptide enhances mature T cell responses and becomes an autoantigen in the absence of microRNA miR-181a. Nat. Immunol. 10, 1162–1169. doi:10.1038/ni.1797 ($)

Wednesday 21 November 2012

Generating random amino acid/DNA/RNA sequences in Python

This is my first post in what I hope to be a recurrent theme, that of bioinformatic practice.

I am by training a wet-lab scientist; my degrees were in molecular genetics, and I'm now doing my PhD in immunology. I've always had a keen interest in bioinformatics, and always tried to do as much as I can, but I've not been formally trained (and I've never claimed to be the most natural mathmatician/statistician).

Accordingly, whenever I'm trying to do some new bit of coding or analysis, I usually like to look around in manuals, papers, blogs and forums to see what and how people are doing things, and see if I can prevent some arduous wheel-reinventing.

I've also noticed that a lot of the time some little snippet of info or code that would have proved very useful to me is omitted by more practised programmers, to whom it would have been so obvious it goes unsaid or forgotten.

In that vein, I plan to post some of the bioinformatic tricks and codes I find and use as I go, in the hopes that I can pay it forward to others who find myself in my position, that is (usually), knowing exactly what I want to do, just not knowing off-hand the names of the functions to do it.

So, kicking off, here's something that I've been meaning to code for a little while; a way to generate random biological sequences (be they protein or nucleic acid sequences), written in Python, based on this biostars post.

This example produces random peptide sequences. For my current purposes, I also wanted these peptides to be of variable length, around a given normal distribution (that I'd measured empirically from the data set I was making these random sequences to act as a control for).

Note that I also wanted to plot the distribution of the newly created peptides; if you didn't want that functionality you can just delete every line with a "# plot" comment.

import random
import matplotlib.pyplot as plt # plot

def random_AA_seq(length):
    return ''.join(random.choice('ACDEFGHIKLMNPQRSTVWY') for i in range(length))

list_size = 3000

lengths = []

for j in range(list_size):

    a = int(random.normalvariate(17, 2))
    lengths.append(a)  # plot
    print random_AA_seq(a)

plt.hist(lengths, bins=14) # plot
plt.show() # plot

You can adjust the distribution of lengths by changing the values fed to normalvariate; the former is the mean, the latter the standard deviation (I deduced the values of 17 and 2 here from the sample I was trying to match).

Then of course these is easily adapted to DNA or RNA by swapping 'ACDEFGHIKLMNPQRSTVWY' for 'ACGT' or 'ACGU'.

Also, thanks go to David Craft, whose blog post on Syntax Highlighter came in useful in this post!

Tuesday 20 November 2012

3D print lab combs

Ever since I read Cory Doctorow's Makers, I've wanted a 3D printer (or at least access to one). Completely unjustifiably, I might add; I freely admit I just want to play, maybe make some custom lego bricks or miniatures of myself or something frivolous.

So it is with great excitement that I read stories like this, about people generating standard, useful lab equipment in house using 3D printers (Russel's blog is particularly relevant, as I could do with some custom mixed-width gel combs that aren't available commercially!).

Every story I read is one step closer to 3D printers becoming standard lab items, making me able to make my own unnecessary bits of plastic fun practical pieces of lab equipment cheaply and conveniently.

Update: I just did a quick search on Thingiverse (a repository of files and instructions to construct objects with tools like 3D printers and laser-cutters), and there already is a selection of electrophoresis parts available.

I have a feeling the DIYbio movement is going to run riot with this technology.

Monday 5 November 2012

Custom MiSeq sequencing primers

Custom sequencing primers opens the door to a lot of possibilities, particularly when attempting amplicon sequencing, allowing you to sequence off your amplification primers and not waste high-quality read data on the one bit of sequence you already knew.

Here follows a list of considerations one might want to take into account when generating custom sequencing oligonucleotides for use on the Illumina MiSeq machine (ignoring all the low diversity issues inherent in Illumina sequencing).

I write this with full disclosure from the outset; I'm relatively new to NGS, new to the MiSeq, and the only runs I've tried using custom primers have failed abysmally. However, in troubleshooting why these might have failed (to feature in a later, longer post) I've assembled a fair bit of information on custom primer design, which might be useful for others (or others might be able to point out where I've gone wrong!).

First, the basics. The MiSeq is the latest offering from sequencing powerhouse Illumina, providing a benchtop alternative to it's larger previous models. It uses the same Solexa-style chemistry as the Genome Analyzer and the HiSeq, but in a smaller box, aimed at lower-throughput applications.

The important thing for this post, is that the MiSeq does support the use of custom primers. These can either be used independently, or spiked into the primer reservoirs for read one or two (see p73 of the MiSeq System User Guide, access probably requires free sign up).

The question then becomes how to design these primers.

The first consideration practically goes without saying; the primer needs to prime, and only where you want it to. Were there to be more than one complementary site per cluster there would be multiple bases seen per cycle, and the cluster would be thrown out.

Within that constraint, the basic idea typically is then to match the characteristics of the Illumina sequencing primers, the sequences of which can be found in the Illumina Customer Sequence Letter (obligatory copyright notice; oligonucleotide sequences © 2007-2012 Illumina, Inc, all rights reserved, yada yada yada).

(By the way: In assessing the Tm of your oligos, apparently Illumina tech suggest using the IDT calculator)

The Illumina sequencing primer 1 (SP1) is 33bp long, 51.5% GC, with a Tm of 65.5°C, while SP2 is a bit longer/tighter binder, being 37bp long, 59.5% GC and having a Tm of 70.1°C. Note that the MiSeq runs hotter than the HiSeq during the deblocking and extension stages, meaning that the Tm of your oligo has to exceed 65°C in order to prevent dissociation from the target.

Logistically speaking, the most important of these criteria to match (or exceed) is probably the Tm; the length and GC content will largely be dictated by your sequences*.

If the primers used to generate your amplicon have a Tm lower than 65°C, there are several workarounds you can use to bring the melting point up to scratch.

One option is to extend your sequencing oligo into the P5 or P7 element that it borders, akin to how the Illumina SP1 oligo overlaps P5 by 5 bases. A note of caution; Illumina tech have warned me that too long an overlap could result in non-specific annealing of primers to the lawn of adapters. I can't see that this would ever result in mis-calling, as the complex would have a huge 3' overhang (therefore not extend, thus contributing no fluorescence), but it could certainly reduce the effective concentration of sequencing primer in the mix.

Another similar sensible option suggested to me recently by Tony Brooks (of UCL Genomics) is to insert a few dummy nucleotides to the 5' of your PCR primer, and then include these in the sequencing oligo, bringing the Tm up without entering the adapter elements.

Lastly, a powerful but potentially tricky option; use modified bases in your sequencing primer to increase the stability. Particularly, the use of Locked Nucleic Acid (LNA) containing oligonucleotides (the subject of a future post I think) has received a lot of talk as a potential way to boost the Tm/specificity without increasing the length.

Custom oligos open doors to a lot of useful and novel sequencing strategies. However, as I'm finding out - to my continued frustration - they do present a wealth of problems, which by their very nature are unique, and of course, unsupported.

If anyone has any pointers, corrections or other advice, please do share in the comments.

TL:DR: Check this nice explanation out. It has pictures.

* As a little aside, it's worth noting that binding of a primer to its cognate site isn't necessarily the key determining factor of its ability to prime; certain motifs may be preferentially favoured by polymerases. However, this is hard to measure; the only hints I'm aware of are a tantalising blog post and a patent application from prolific professor Jian Han (from the HudsonAlpha Institute).

Thursday 25 October 2012

Weird and wonderful

In my free minutes, between experiments or when I'm grabbing a breather, I like to click around and explore those bits of the news and science that aren't strictly in my discipline. Today I saw a couple of articles (both via Ed Yong, from one route or another),which have stuck with me, which I thought might be worth sharing.

The weird first, without much preamble; a movie of a duck's penis. This doesn't require any explanation, except maybe from god. Mindbleach, please.

Then on to the wonderful, with this blog post (combined with this article), talking about micro-chimerism in mothers.

This deals with a rather beautiful aspect of mammalian biology, where cells from the developing foetus enter the circulation of the mother, and are even detectable after birth.

The latter paper even reports detecting the DNA of these cells over 27 years after the birth of the child (by looking for Y chromosome DNA from a mother who's borne sons).

I've always known there was so much of my mother in me (about half, genetically speaking), but it's profoundly lovely to think that there's probably a bit of me in her.


Monday 22 October 2012

UCL Triple-Eye Symposium

I meant to write this post over the weekend, but unfortunately a dinner of all I could eat barbecue meant I spent most of the time sleeping and rubbing my stomach. Now I've recovered somewhat, I just thought I'd share a couple of highlights of Friday's symposium

It was the UCL Infection, Immunology & Inflammation Domain's third annual symposium, celebrating the work of this aggregation of UCL (and partner institution) academics' research.

There were a few highlights for me. The keynote speaker, Stephen Goff, gave an engaging account of his work into embryonic stem cell restriction of retroviral infection.

Another great talk came from one of our BiPR colleagues, Brenden Wren, who studies bacterial glycosylation, but moreover has developed a glyco-toolkit, allowing bacterial production of proteins-of-interest with desired sugar modifications.

However the best bit of the day was a bit more selfish, as two PhDs in our lab (myself and Lucy Bell) won first prize in our respective poster sessions, which was very warmly appreciated!

There had been a lot of interest in our TCR repertoire work throughout the poster sessions, particularly to a figure I'd presented of some of the difficulties inherent in deep-sequencing TCR repertoires. I think I might expand on this for a later blog post, so if that's interesting to you, watch this space.

Saturday 6 October 2012

Restriction digest with OLD enzyme

I suspect most labs are like mine, with freezers overflowing with old, unused restriction enzmyes, bought for some odd bit of cloning, used once, then kept in the freezer forevermore.

In most labs I've worked in, the general rule of thumb for out of date enzymes was just add a few more units (up to the 10% of total volume permissable to prevent glycerol inhibiting the reaction), and maybe run a bit longer.

However, it's not until my current lab that I've ever found REALLY old enzymes. As in, enzymes older than some of the younger PhDs in the lab.

I've always suspected that the expiration dates on these are largely guesswork, so I thought I'd try out the oldest enzymes I could find.

I wanted to go with an aliquot of AluI I found, dated for September 1989 (although it doesn't say whether this is an expiry date or when it was made). Unfortunately, the lid for AluI is lost to the mists of time; the tube is just full of (likely 20-year old) ice.


However, I did find a tube of BstYI that appears to be of a similar age, perhaps even older; the labelling is fairly similar, but the lack of a date makes me question whether it predates the AluI (and inclusion of estimated expiration dates). Maybe there's someone at NEB who can sort this out - I'll investigate that. At the very earliest, it seems BstYI would have appeared around 1988.

I mixed up a quick 20μl digestion mix, using 2μl enzyme in NEBuffer 4 to digest around a microgram of pUC19 plasmid DNA, incubated at 65°C for two hours.


Lo and behold, it works just fine (presumably - I don't have any in-date BstYI to compare this against). This is an enzyme that is likely somewhere in the region of 25 to 28 years old. I'm not sure if I'll ever pay attention to expiration dates again.

NB: doing a quick search around for this write up showed me this article, which makes me wonder if I shouldn't be surprised; it implies that the companies don't tend to make up many batches of these enzymes, just thaw old ones and assay them for activity!

It's also probably worth noting that this seems to be a fairly robust enzyme, which has been kept at minus twenty for the vast majority of its life (it looks barely used), thus these findings might not apply to other enzymes.


Move to blogspot (and out of inaction?)

With the best of all intentions, last year or I so I set up a Newsgrape account (when it was in beta) to try and spark off a bit of sci-blogging. With the first year of my PhD hogging most of my time, that kind of fell by the way-side.

However, when I then tried to get back into it, I found that the developing Newsgrape hadn't evolved quite as I'd expected; rather than the eclectic blogging community I'd anticipated it had ended up a rather bizarre commercial, uber-syndication service.

I'm sure this is great for some, but it doesn't really push my buttons.

As such, I've dusted off this old blogger account (once I remembered I had it). I plan to port over what few articles I'd put up at Newsgrape*, then start to be ever so slightly more active than I was - which honestly, won't take much.

*I think I might try and back date them so they're roughly in order, which might make this look a bit odd for a first post.

Saturday 5 May 2012

The HIV-TB Dual Epidemic

The following is an article I wrote for a competition for the good people at www.results.org. It didn't win, but you might enjoy it.


I have not met anywhere close to thirteen million people, and nor will I ever. It's just too many, an incomprehensible number. However, this is the extraordinary figure is the estimated number of people that are unfortunate enough to be infected with not one, but two of the worst pathogenic diseases facing humanity today.

The dual-epidemics of Human Immunodeficiency Virus (HIV) and tuberculosis (TB) are increasingly rife across the world, but the hammer falls heaviest in sub-Saharan Africa, causing suffering and mortality to far too many people.

Globally, 40 million people are estimated to be infected with HIV, a third of whom coinfected with Mycobacterium tuberculosis (MTB) which is the bacteria responsible for causing TB. This overlap of epidemics is cause for great concern, as combined these pathogens cause worse a worse disease than the sum of their parts. While the exact mechanisms underlying this pathogenic collaboration are still the subject of intensive research, we can gain insights into why this happens based on what we know of the life-cycles of the individual microbes.

HIV is a retrovirus, which means that instead of carrying a DNA genome like ours it has uses a related molecule, RNA, which it will convert to DNA after infecting a cell. This DNA can then be inserted into the DNA of the cell it has infected, allowing the virus to stay in that cell for as long as it lives.
 
When someone contracts HIV, they might feel poorly and show vague symptoms, but chances are the virus will pass undetected. After this, the virus enters a latent life-cycle in the white blood cells that it infects; macrophages and, primarily, T cells, which are both important members of the body’s immune system. The type of T cells that HIV infects and kills (CD4 positive, or 'helper' T cells) are particularly crucial in staying healthy, as they regulate and coordinate the response of many other immune cells.

It can take many years for the virus to make itself known, but when it does it wreaks havoc on the very immune system it's inhabiting, causing the death of vast numbers of CD4+ T-cells. It is this lack of T-cells that causes the immunodeficiency seen in AIDS, allowing any opportunistic infectious agent to cause serious disease.

MTB is a small, hardy bacterium, which typically invades people through their lungs, hitch-hiking in droplets of moisture exhaled from someone who's already infected. Once inhaled, MTB gets taken into the alveoli (or air-sacs) of the lungs.

Lungs are usually well prepared to fend off such attacks, being well stocked with immune cells. In particular, there are many alveolar macrophages, whose job it is to engulf and destroy any toxins or pathogens that have found their way in. However, MTB has turned this defence against us, infecting those very same macrophages. To rub salt in the wound, the bacteria then replicate in the very cellular compartment where bacteria are usually degraded.

Another slow burner, MTB can exist for years like this, hidden away in their pockets within cells, causing no disease and spreading to no new hosts, contained at a low level by the rest of the immune system. However, as time goes on, the chances of immune surveillance waning become much greater; should it fall too low MTB can reactivate, causing disease and taking it's toll on a body.

It is the insidious nature of these pathogens that makes the overlap in their infections so much worse. Both creep in under the radar, infecting the very cells the body uses to fight disease, unknowingly combining in this terrible synergy we see in our dual-endemic regions. 

MTB is expert making itself at home in the most dangerous part of the cells responsible for eating other bacteria, but usually they remain held in check, awaiting the chance to pounce. HIV on the other hand, is finely tuned at sneaking in and lying dormant, gradually consolidating its base, all the while whittling away at the immune system from the inside until it's all but gone.

It's easy to see why coinfection can be so devastating. The virus gives the keys of the body to the bacterium, and the bacterium throws a party and trashes the place.
Today, these two diseases together are infecting and killing thousands of people every year, and often in the areas that are least able to deal with such disasters.
But there is hope. 

The spread of HIV can be curtailed through education, and low-tech, easy to implement preventions. Barrier contraceptives and male circumcision are cheap, fast, and effective, to name but two. While prohibitively expensive, highly active antiretroviral therapy (or HAART) regimens are growing ever more effective at suppressing the virus, meaning their immune systems are free to fight off other diseases.

Solutions also exist for preventing and controlling MTB-caused TB. Improved hygiene measures, antibacterial solutions and education can limit the spread, while BCG vaccination can help prevent infection with MTB, particularly in the young. There is also a range of pharmaceuticals, antibiotics and MTB-specific inhibitors, which can suppress and even eventually clear the infection.

None of these solutions are perfect, and even if they were there are many obstacles to getting the right information and help to those that need it. We need to fight both diseases, simultaneously on all fronts, to stop people suffering from either. Research, policy and education continue to make great progress in combating these epidemics, but so many people are still suffering, so there is still much work left to do.